Build a pipeline using Elastic stack
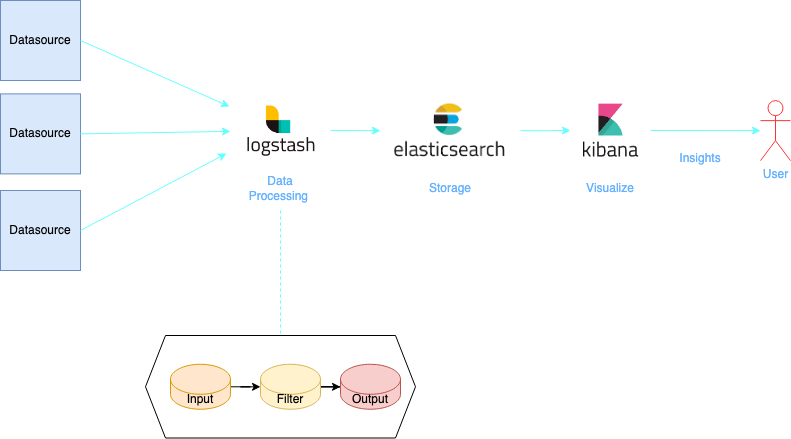
Elastic stack—also known as ELK stack—primarily consists of three open-source projects Elasticsearch (Search and Analytics Engine) , Logstash (ETL) and Kibana (Visualization).
Some of the main use cases of ELK stack are observability, security analytics and powering enterprise search engines. The stack is managed and supported by Elastic.
A brief introduction of the main components
Elasticsearch
Elasticsearch is a search engine based on the Lucene library. It provides a distributed, multitenant-capable full-text search engine with an HTTP web interface and schema-free JSON documents. The first version of Elasticsearch was released by Shay Banon in February 2010.
Known for its simple REST APIs, distributed nature, speed, and scalability, Elasticsearch is the central component of the Elastic Stack.
Data is stored as an index in elasticsearch. An index is like a ‘database’ in a relational database.
Logstash
Logstash, one of the core products of the Elastic Stack, is used to aggregate and process data and send it to Elasticsearch. Logstash is an open source, server-side data processing pipeline that enables you to ingest data from multiple sources simultaneously and enrich and transform it before it is indexed into Elasticsearch.
Let’s dive in to the three main components of Logstash.
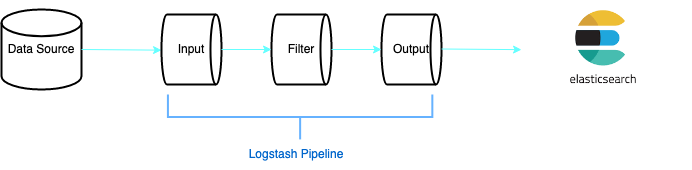
- Input — It’s used to consume data from the data source, it provides a way to fetch data from the data source.
- Filter — An optional component, this is used to parse and clean the data.
- Output — The output plugin redirects the cleaned data to its destination.
Already there are many plugins/connectors supported by Elastic, you can find some inputs and outputs examples.
Kibana
Kibana is a data visualization and management tool for Elasticsearch that provides real-time histograms, line graphs, pie charts, and maps. Kibana also includes advanced applications such as Canvas, which allows users to create custom dynamic infographics based on their data, and Elastic Maps for visualizing geospatial data.
Setting up Elastic stack
Elasticsearch & Kibana
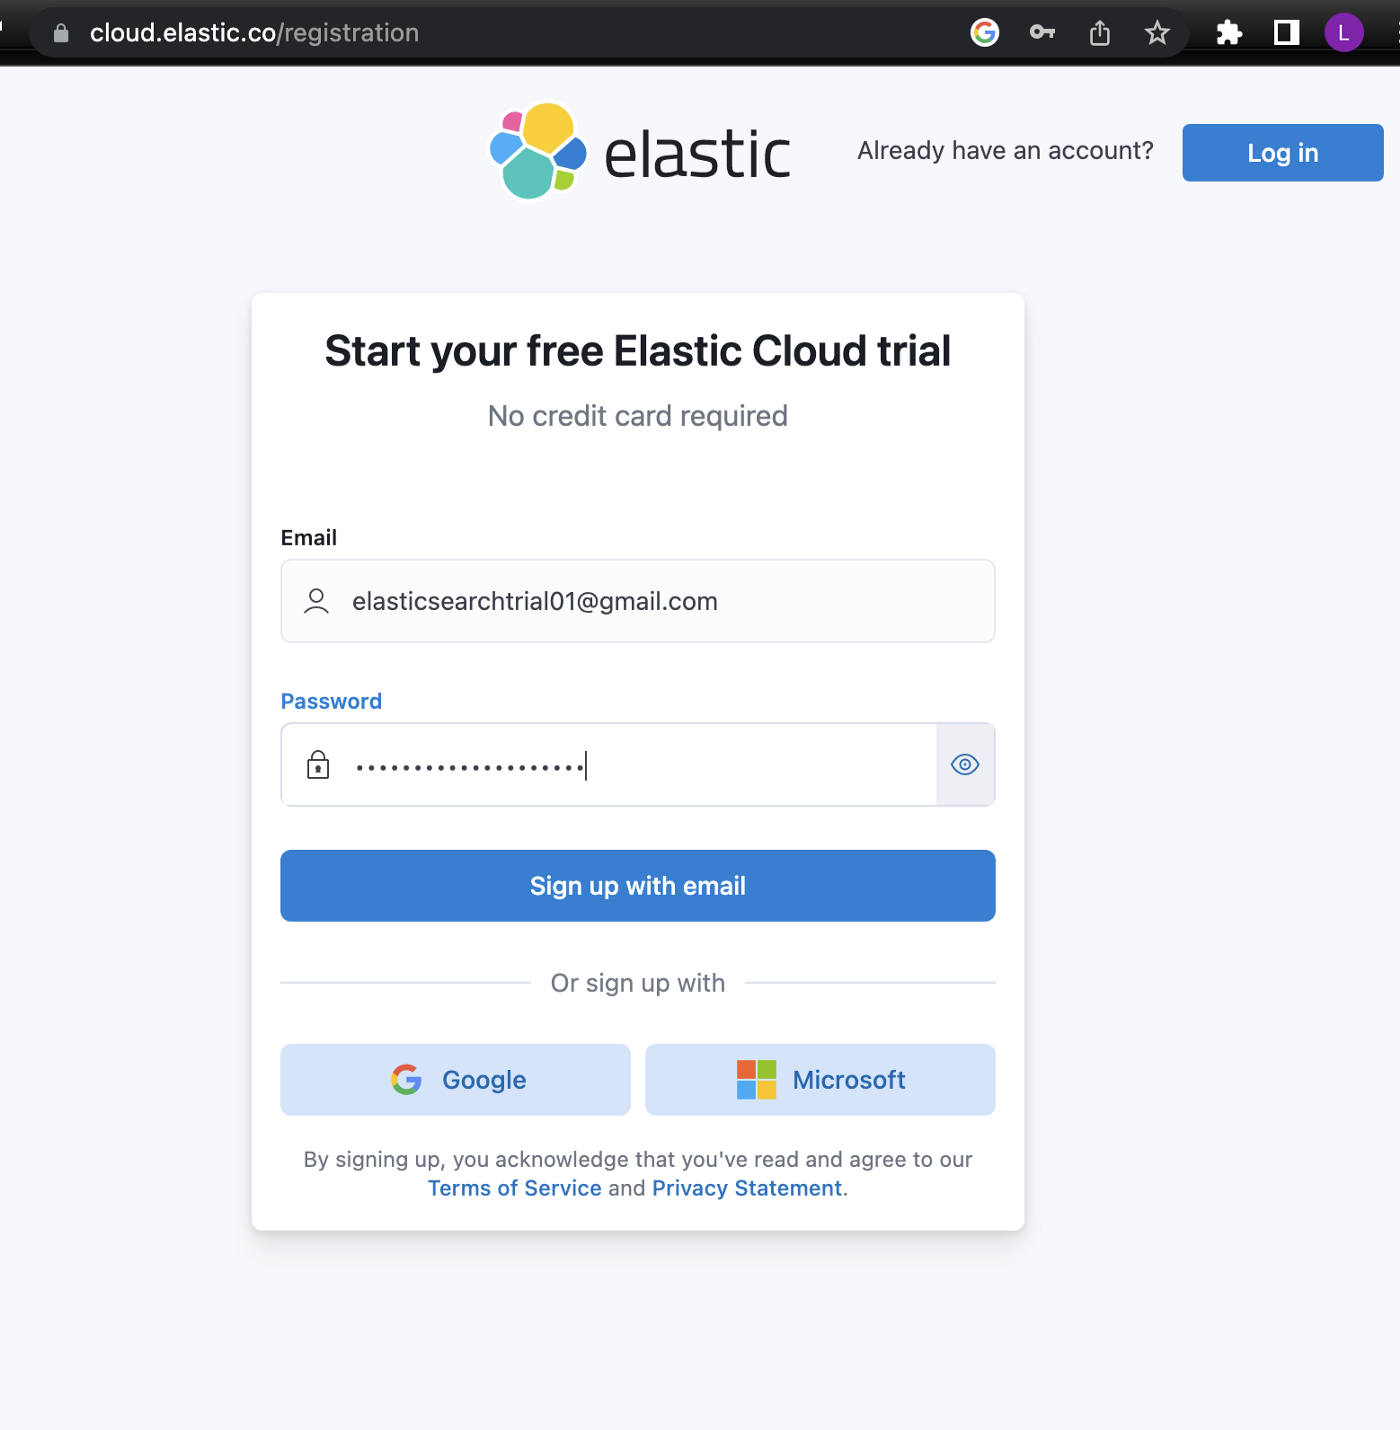
We will be using a hosted Elastic cloud here, Elastic offers a trial for 14 days, this is a good option if you want to explore the features of elasticsearch and kibana without having to worry about installation and configuration.
You can register on elastic cloud and follow the instructions on the screen, as we proceed we will be asked to fill in few details.
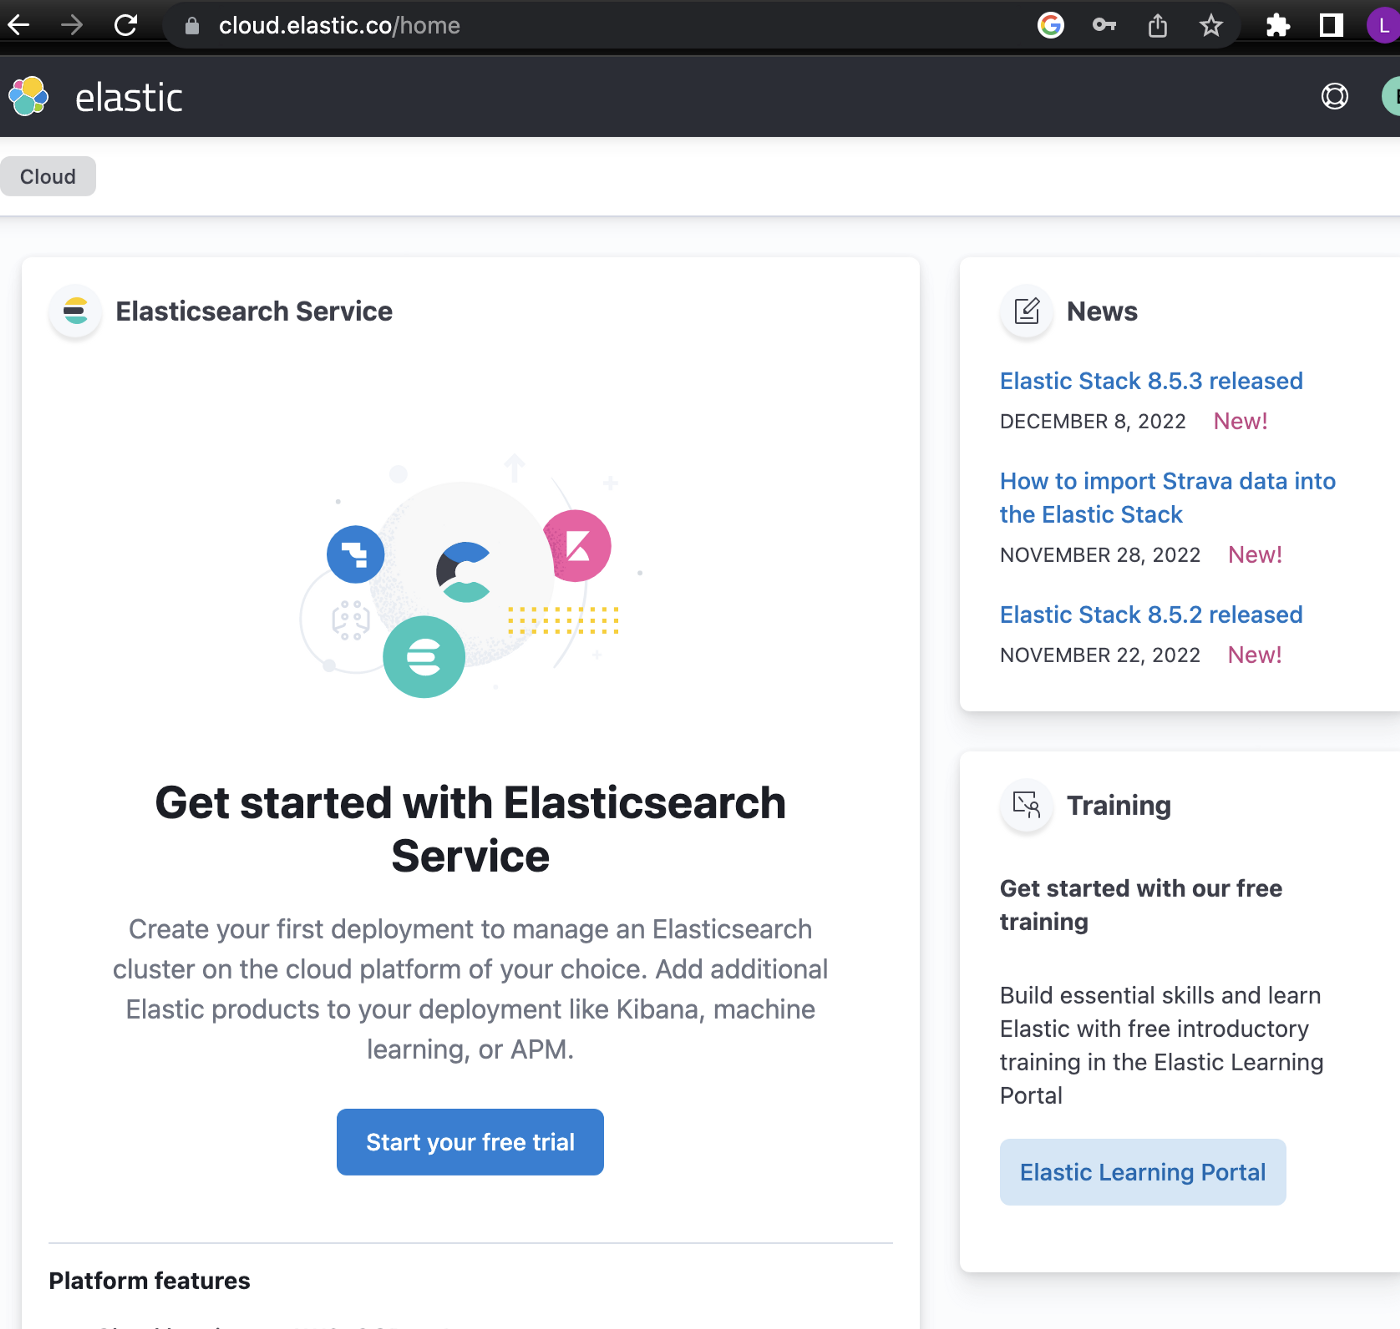
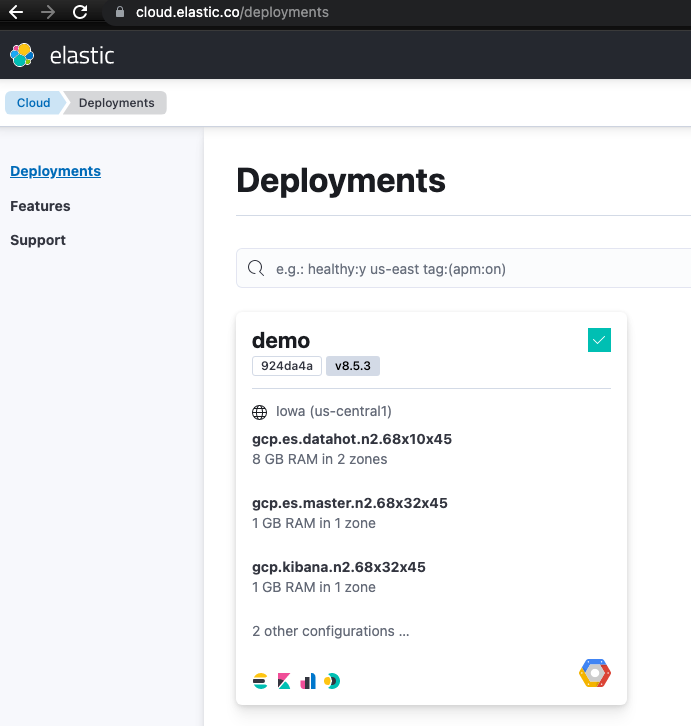
We are going to name our deployment “demo”
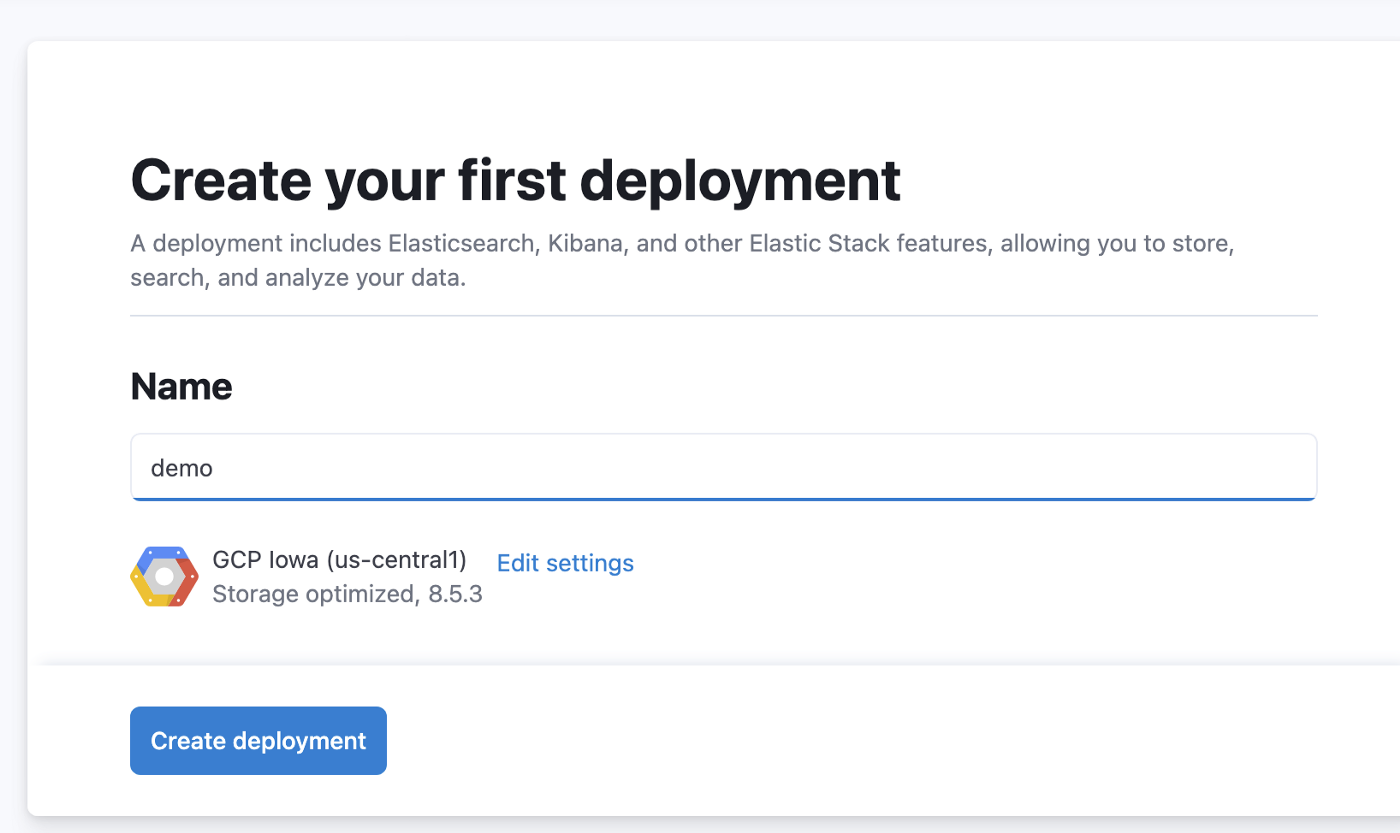
It generally takes a few minutes for the instance to be created, in the meantime let’s download the elasticsearch credentials, we will need them later.
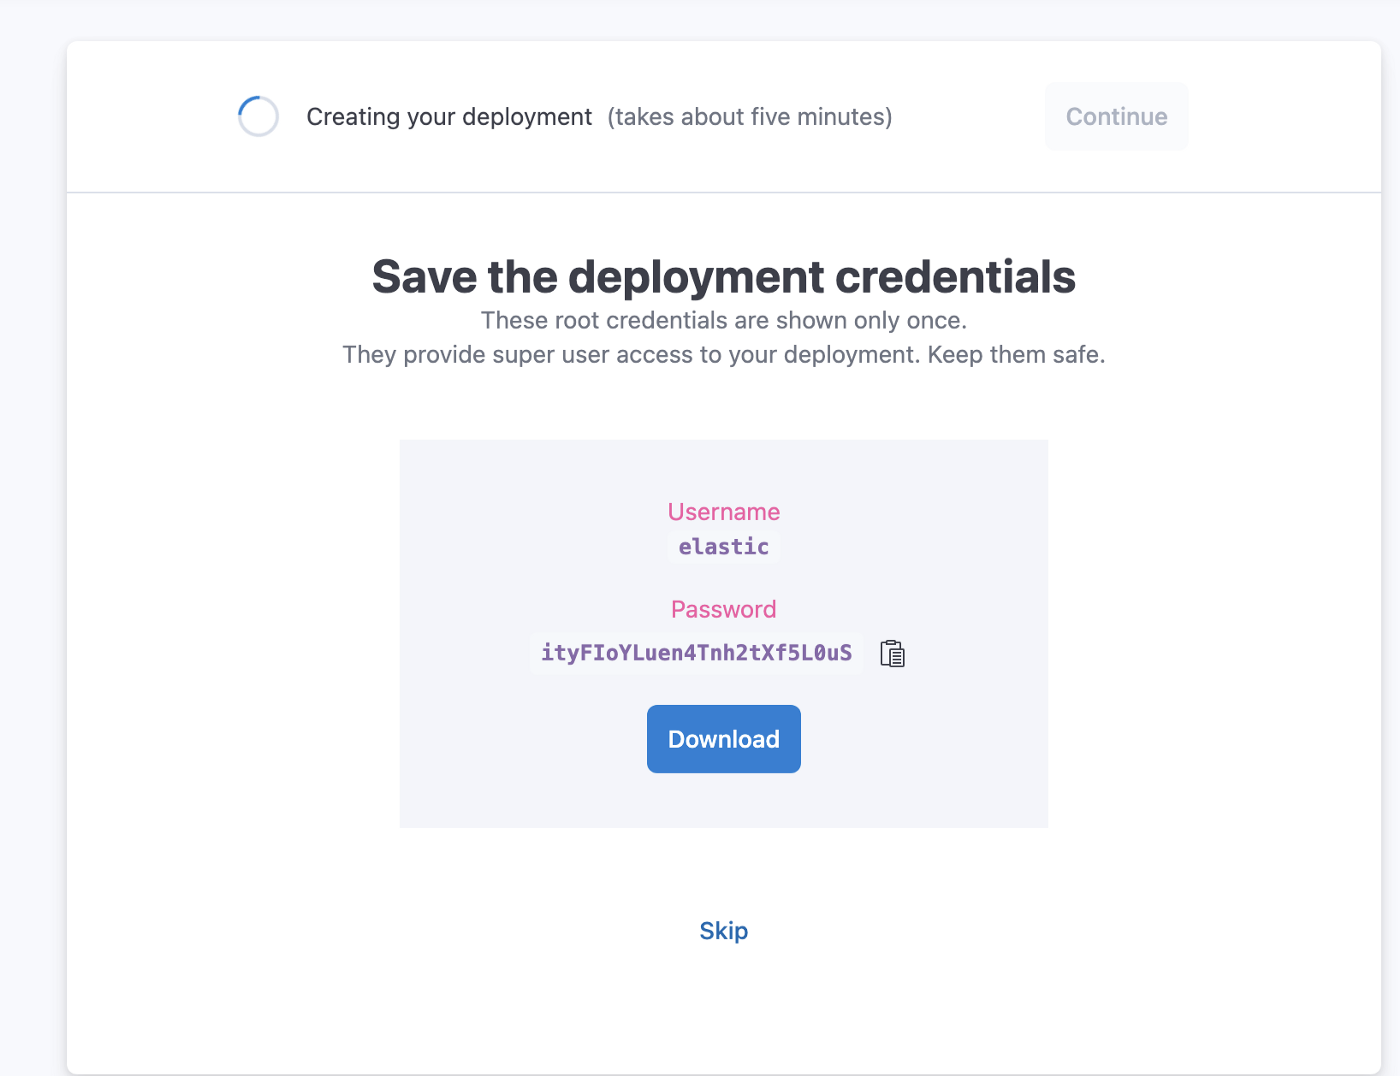
This credential will be used to communicate with Elasticsearch.
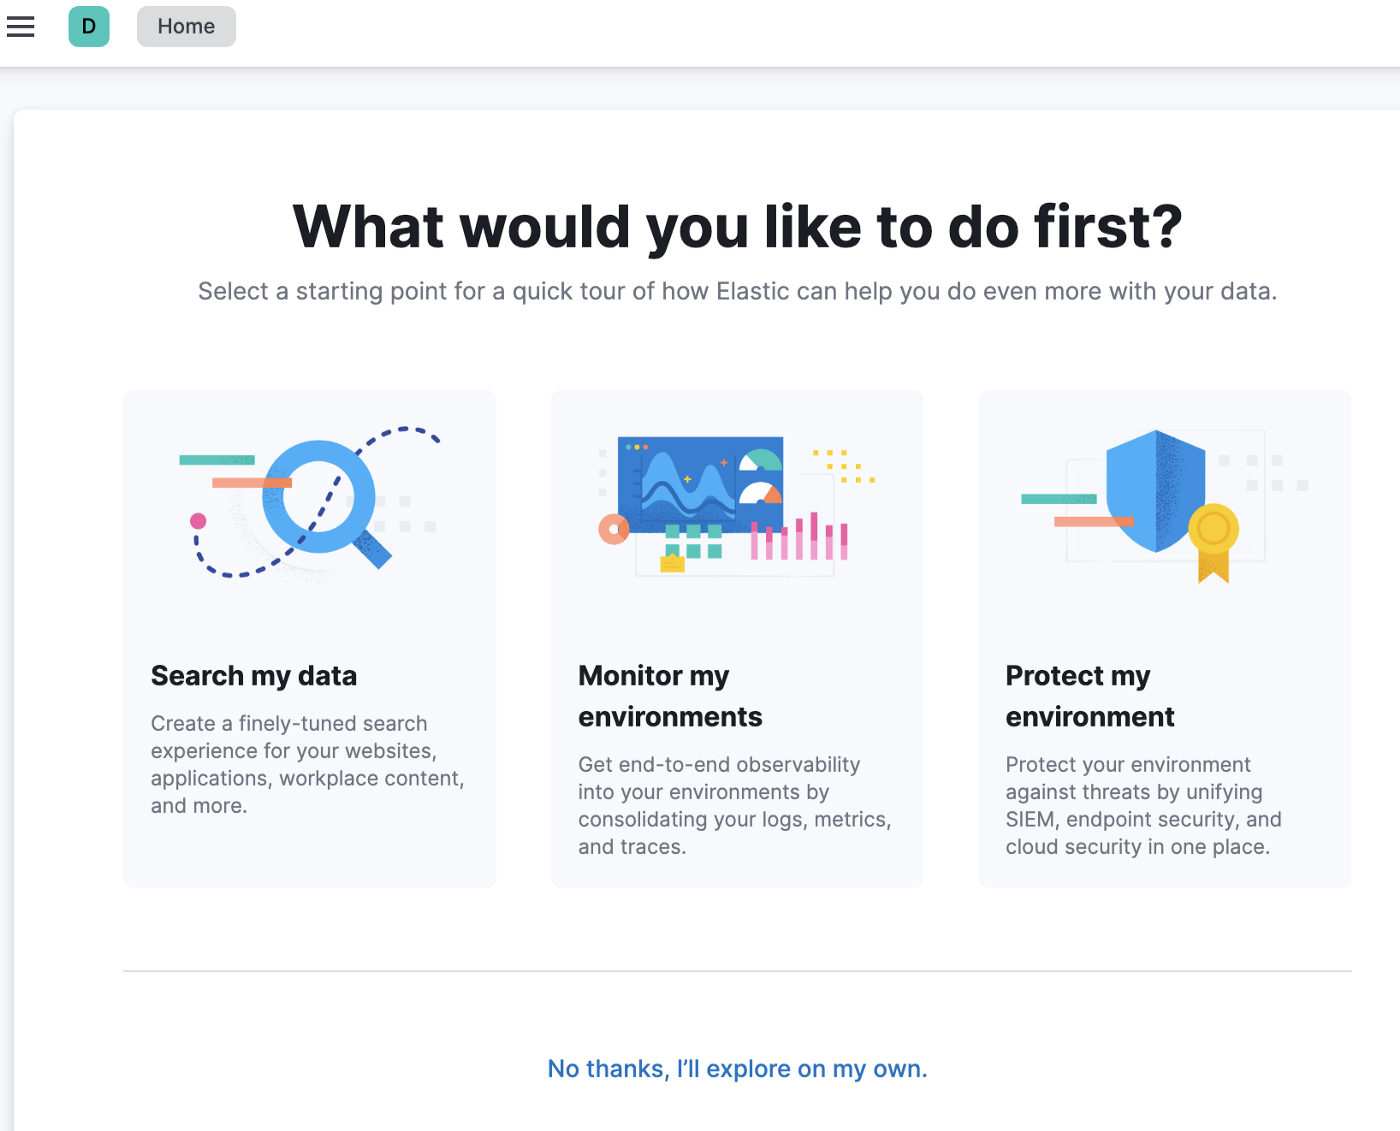
Press continue once the deployment has been completed, we will see the below page for now, let's click on “No thanks, I’ll explore on my own.”
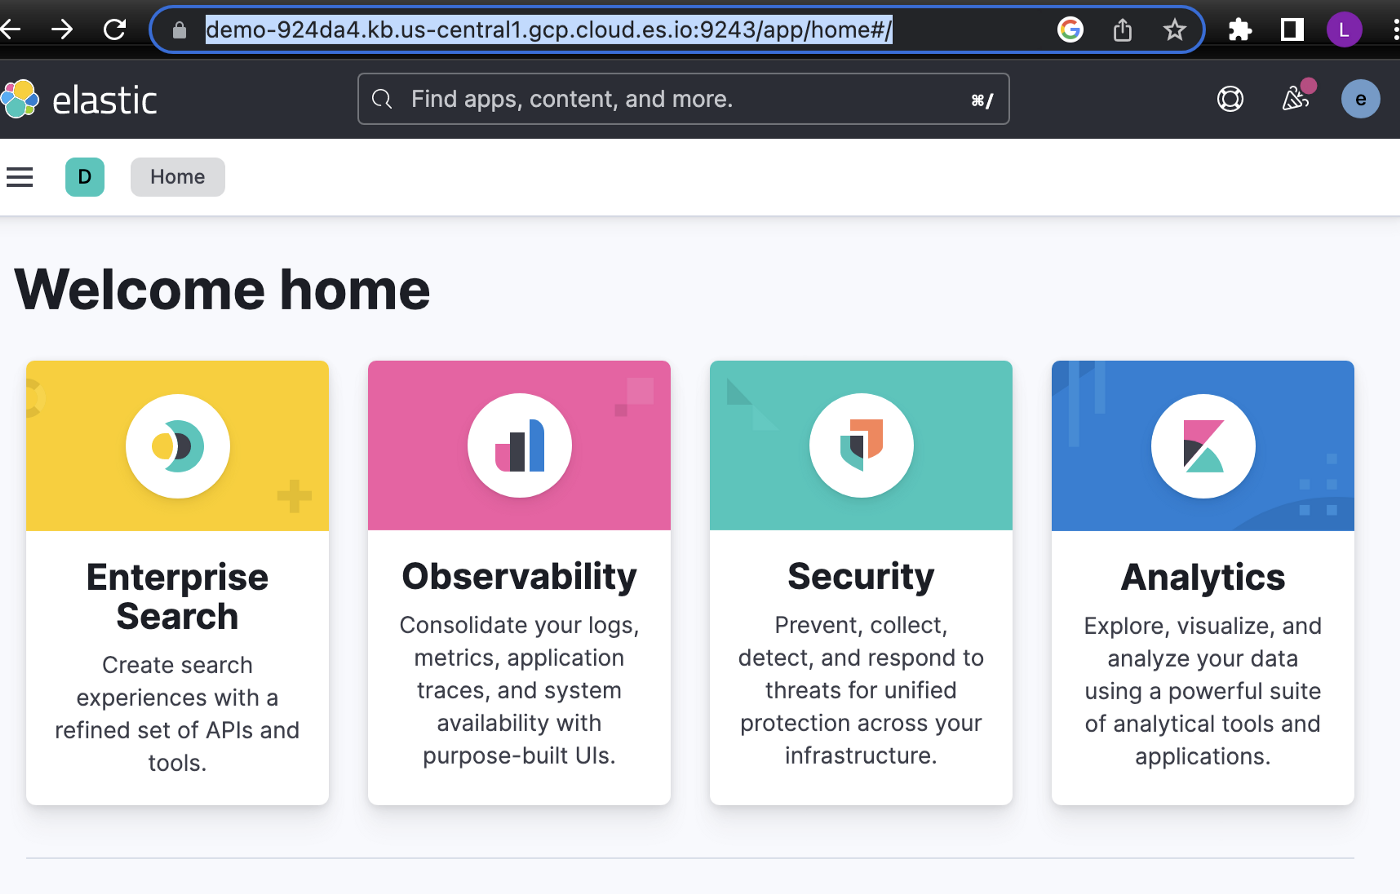
Let’s save this URL , we will need it for accessing our deployment/kibana.
This cloud deployment has spun up few elasticsearch nodes and a kibana node. We can check our deployments.
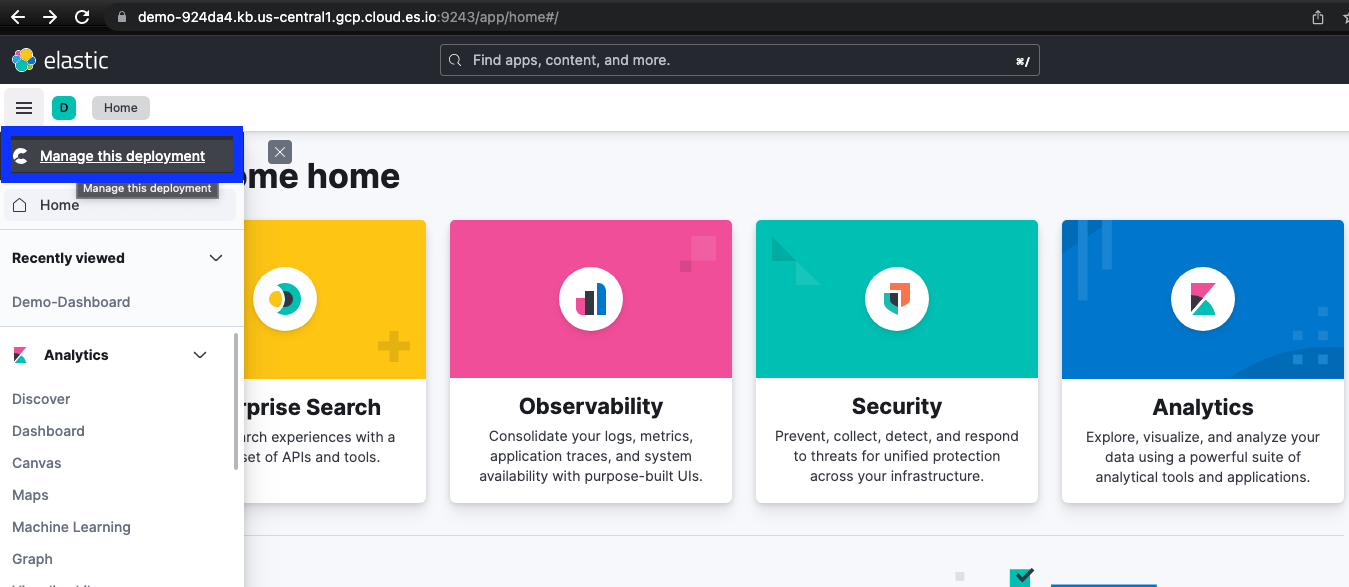
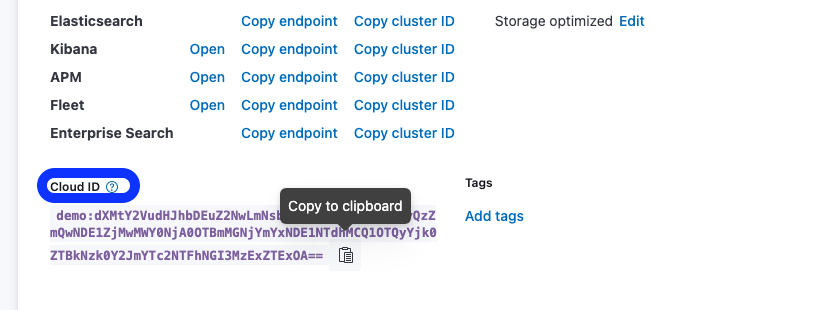
Now let’s copy the Cloud ID related to this deployment, we will need it while configuring logstash output. Click on “Manage this deployment” and from the next page copy the Cloud ID, we will save it somewhere safe for later use.
Setting up the logstash instance
I will setup a local instance of logstash in my local system. Let’s check the jvm version on our local system.
lijuthomas@Lina ~ java -version
openjdk version "19.0.1" 2022-10-18
OpenJDK Runtime Environment Homebrew (build 19.0.1)
OpenJDK 64-Bit Server VM Homebrew (build 19.0.1, mixed mode, sharing)Installing Elasticsearch
Here the list of the compatible JDK versions for each ELK component. For this demo we will be using tar version of logstash, I used this tar.
Untar the logstash binary and cd into logstash-8.5.3 directory.
tar -zxvf logstash-8.5.3-darwin-x86_64.tar.gz
cd logstash-8.5.3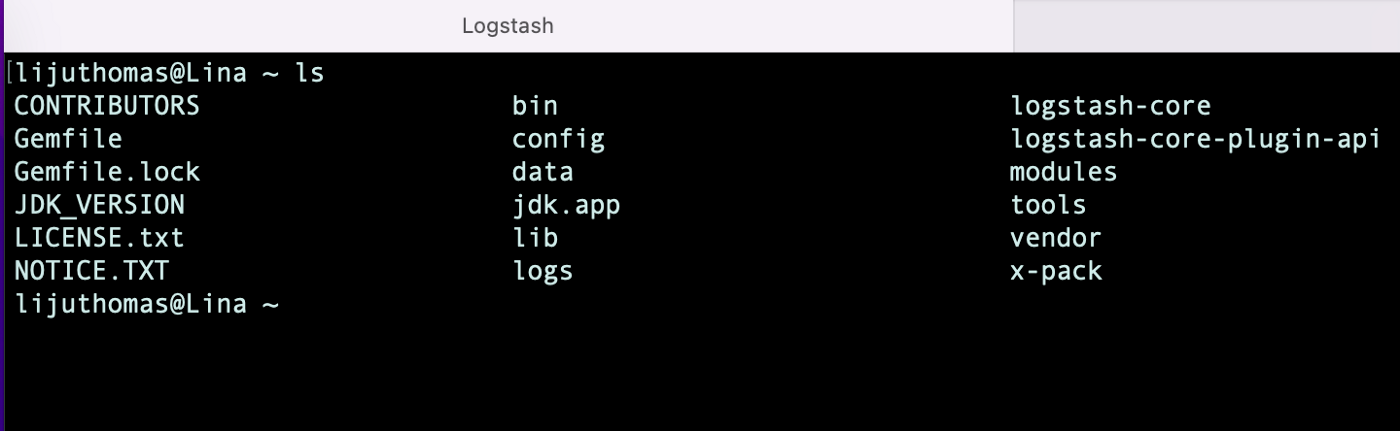
Now that we have all three components ready, we will move to the next step which is building a logstash pipeline to ingest some sample data into Elasticsearch, once the data is ingested successfully we will validate the index, view the mapping, create a data view and create some simple visualizations.
Input Dataset
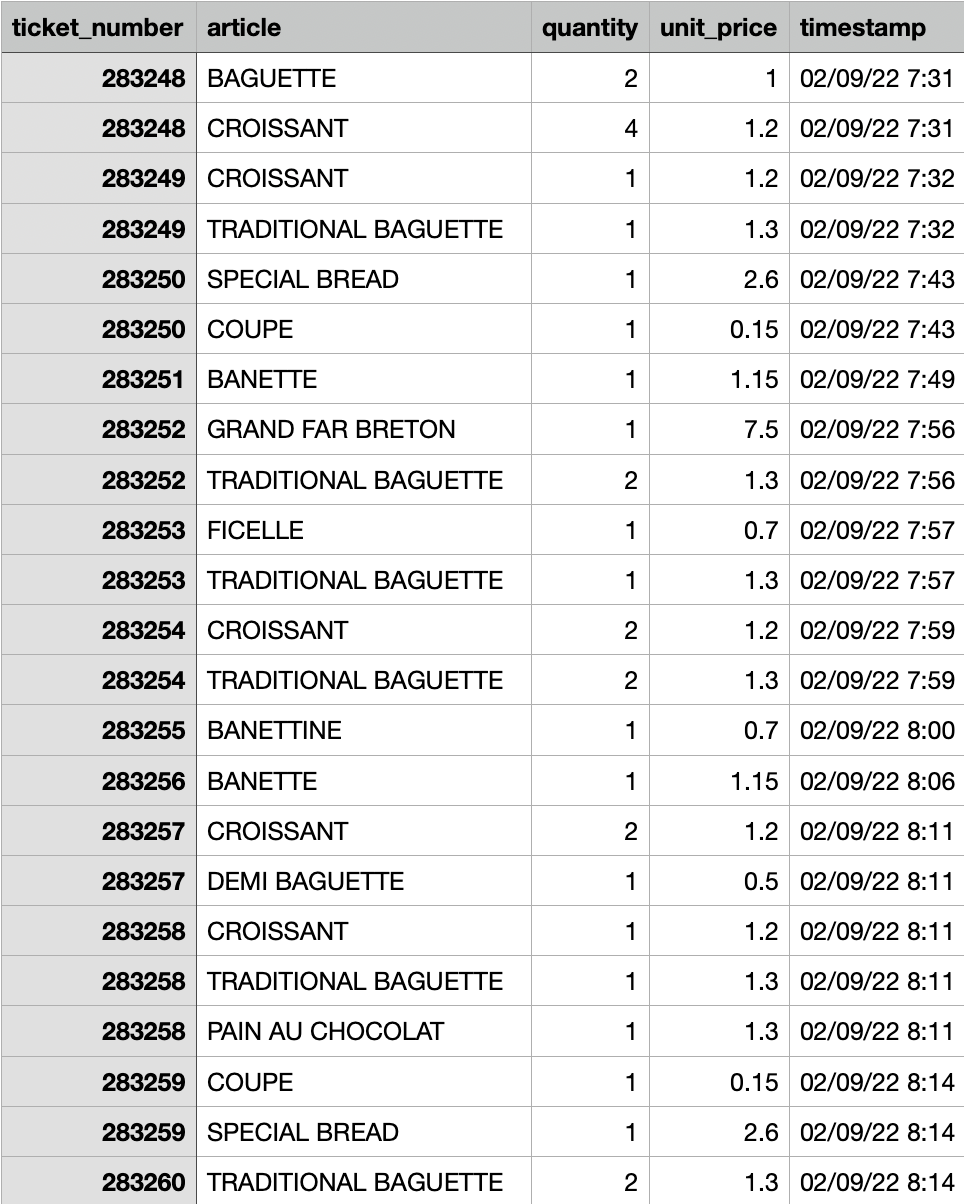
For this demo I’m using sample data extracted with minor transformation from the French bakery daily sales dataset that is available on Kaggle, We will be using the sales data from the month of September 2022.
The dataset is in CSV format, let’s check the contents once.
Creating the logstash config file
input {
file {
path => "/Users/lijuthomas/Documents/Elasticsearch/Dataset/bakery-september.csv"
start_position => "beginning"
sincedb_path => "/dev/null"
}
}
filter {
csv {
separator => ","
skip_header => "true"
columns => ["ticket_number","article","quantity","unit_price","timestamp"]
}
mutate{
convert => ["ticket_number","integer"]
convert => ["article","string"]
convert => ["quantity","integer"]
convert => ["unit_price","float"]
}
date{
match => ["timestamp", "dd/MM/yy HH:mm"]
}
}
output {
elasticsearch {
cloud_id => "demo:dXMtY2VudHJhbDEuZ2NwLmNsb3VkLmVzLmlvOjQ0MyQzZmQwNDE1ZjMwMWY0NjA0OTBmMGNjYmYxNDE1NTdhMCQ1OTQyYjk0ZTBkNzk0Y2JmYTc2NTFhNGI3MzExZTExOA=="
cloud_auth => "elastic:ityFIoYLuen4Tnh2tXf5L0uS"
index => "french-bakery"
}
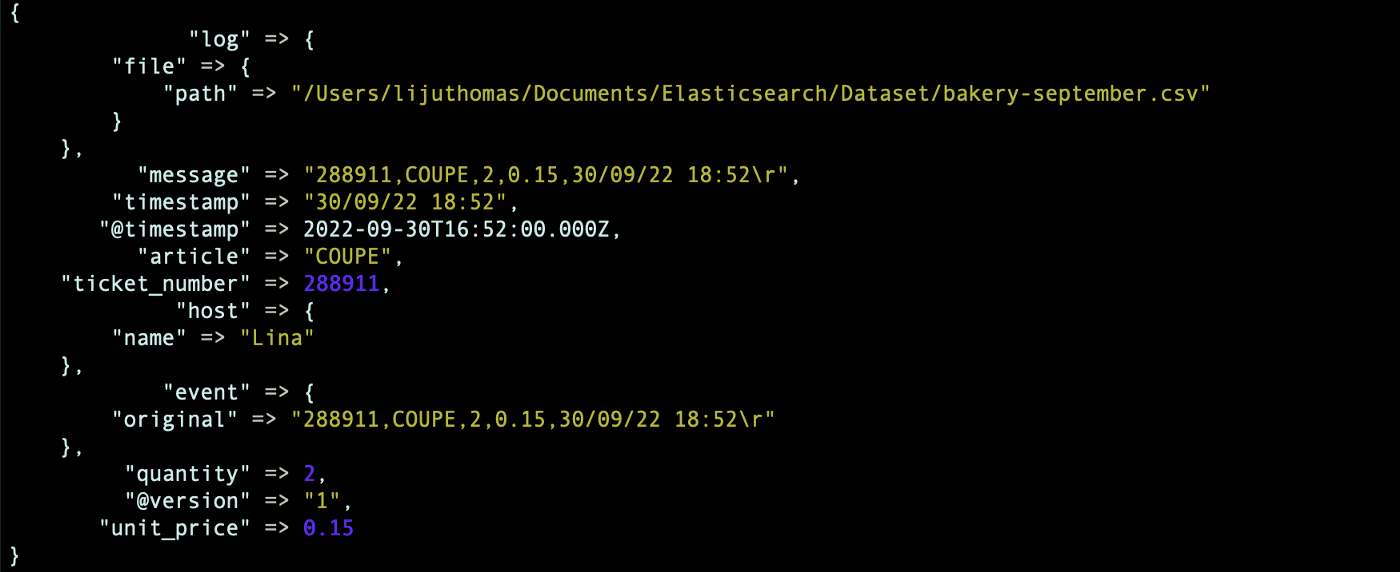
stdout {}
}A brief explanation regarding the conf file — The input section contains the location where input csv is stored, we are doing some minor data type transformation inside the filter section after reading the input data, and the output section contains the destination detail where the transformed data needs to be sent, in our case its the Elastic cloud instance, here we have used the cloud_id and credentials that was saved in the previous step and also defined the elasticsearch index name “french-bakery”.
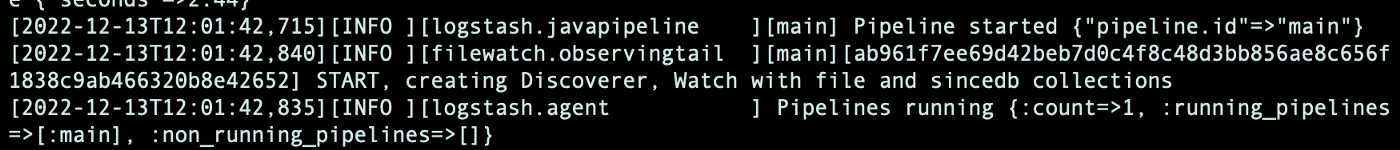
We will save this conf file inside logstash-8.5.3/config directory, now let’s execute the conf file using the below command.
/mylocation/logstash-8.5.3/bin/logstash -f /mylocation/logstash-8.5.3/config/bakery-read1.confWe will see the below messages once the pipeline starts successfully
Validating the index
Let’s validate the index via the kibana console using “Dev Tools”
GET /_cat/indices/french-bakery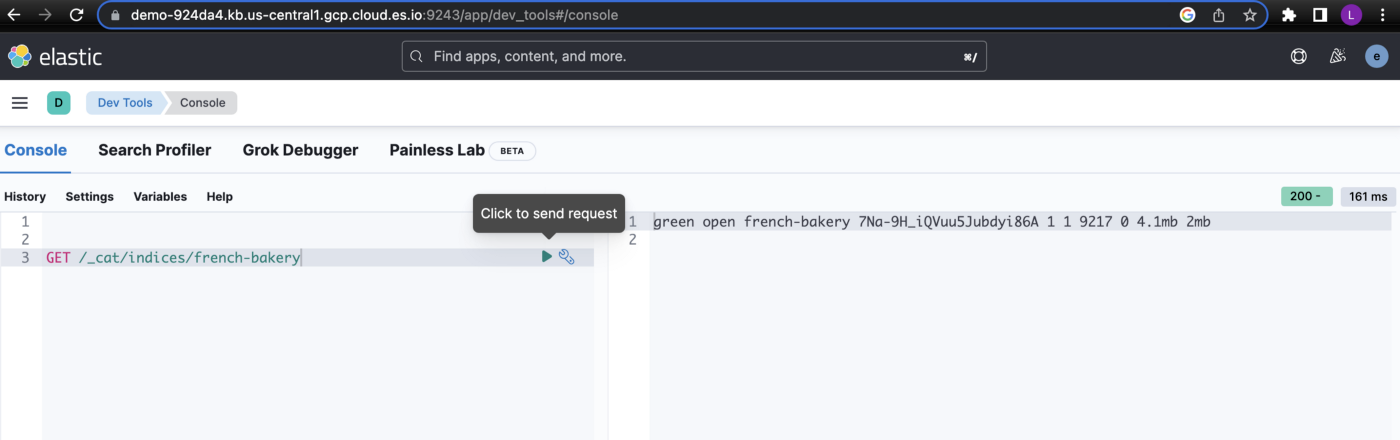
Now let’s view the index mapping of newly created index
GET french-bakery/_mapping{
"french-bakery": {
"mappings": {
"properties": {
"@timestamp": {
"type": "date"
},
"@version": {
"type": "text",
"fields": {
"keyword": {
"type": "keyword",
"ignore_above": 256
}
}
},
"article": {
"type": "text",
"fields": {
"keyword": {
"type": "keyword",
"ignore_above": 256
}
}
},
"event": {
"properties": {
"original": {
"type": "text",
"fields": {
"keyword": {
"type": "keyword",
"ignore_above": 256
}
}
}
}
},
"host": {
"properties": {
"name": {
"type": "text",
"fields": {
"keyword": {
"type": "keyword",
"ignore_above": 256
}
}
}
}
},
"log": {
"properties": {
"file": {
"properties": {
"path": {
"type": "text",
"fields": {
"keyword": {
"type": "keyword",
"ignore_above": 256
}
}
}
}
}
}
},
"message": {
"type": "text",
"fields": {
"keyword": {
"type": "keyword",
"ignore_above": 256
}
}
},
"quantity": {
"type": "long"
},
"tags": {
"type": "text",
"fields": {
"keyword": {
"type": "keyword",
"ignore_above": 256
}
}
},
"ticket_number": {
"type": "long"
},
"timestamp": {
"type": "text",
"fields": {
"keyword": {
"type": "keyword",
"ignore_above": 256
}
}
},
"unit_price": {
"type": "float"
}
}
}
}
}For the current index “french-bakery” we didn’t define any mapping, elasticsearch did that for us, this automatic detection and addition of new fields is called dynamic mapping. As we are just exploring the stack so that’s fine for now.
Mapping can significantly affect how Elasticsearch searches and stores data, so in a production environment it is advised to use either explicit mapping or customized dynamic mapping
More details related to mapping.
Creating data views and visualising the data
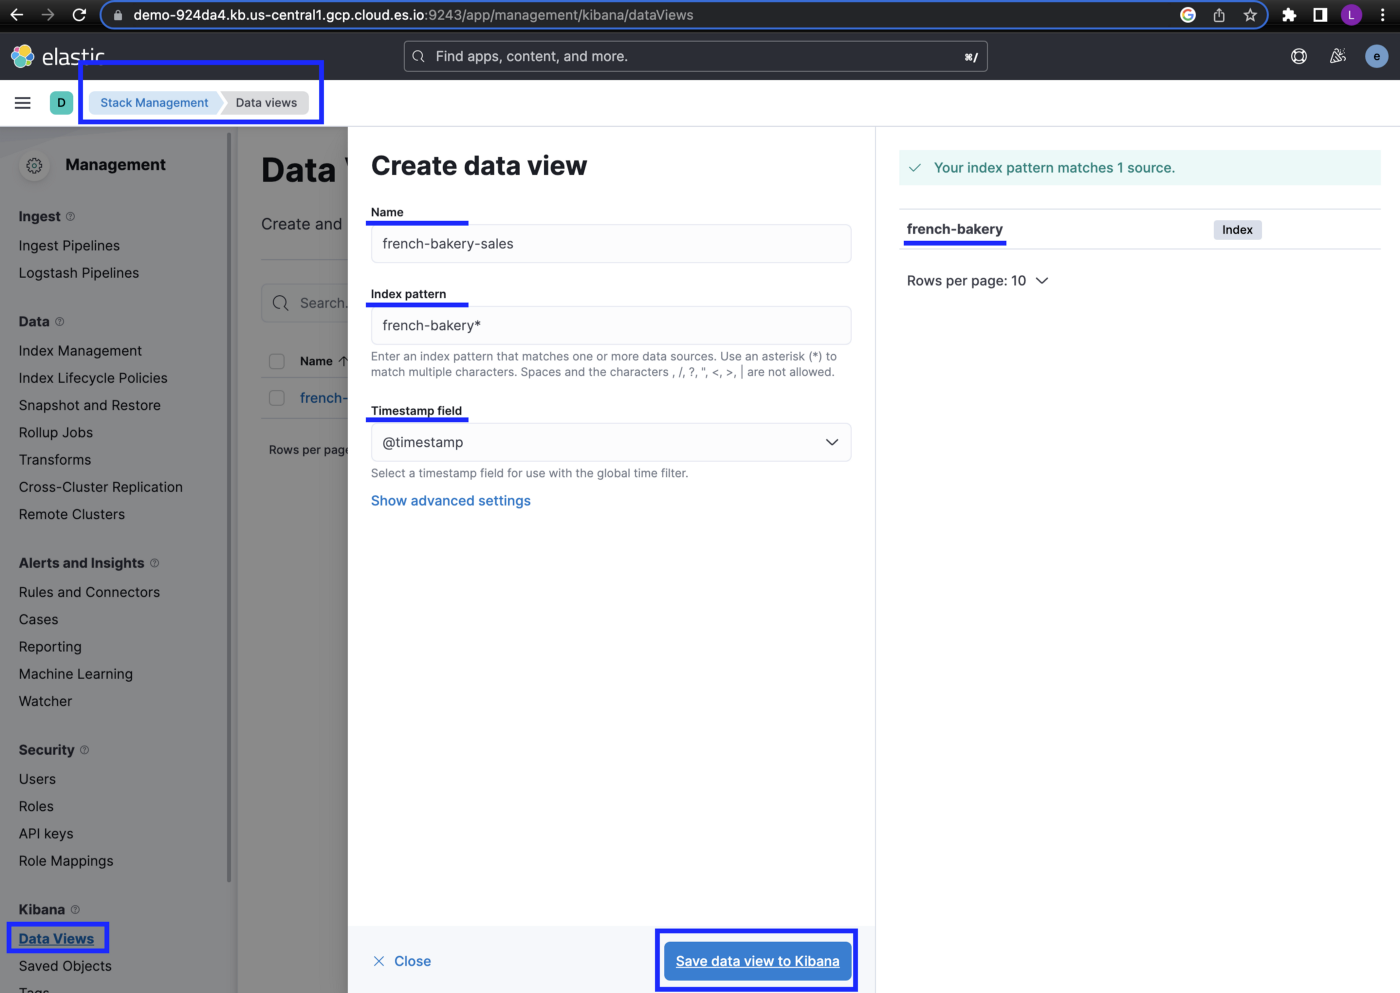
In kibana under Stack Management select Data views → Create data view → Update Name, Index pattern & Timestamp field → Save data view to kibana
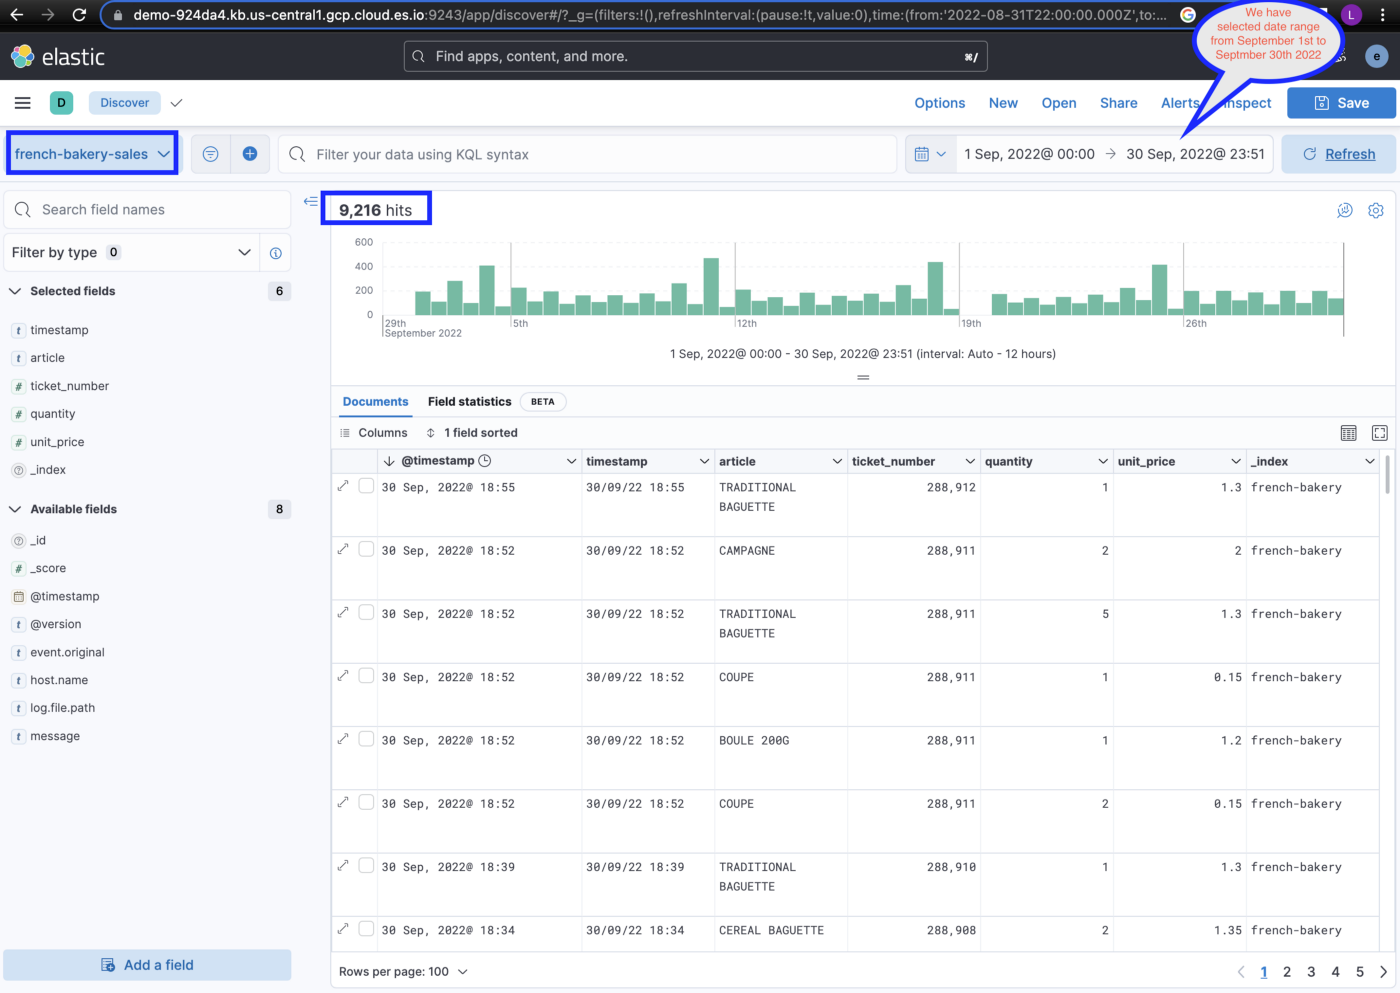
Let’s use this data view to view our data, you can see around 9216 hits, which means there are 9216 documents in the index for the selected date range
Let’s create a dashboard with a few simple visualizations using our index and try to gain some insights
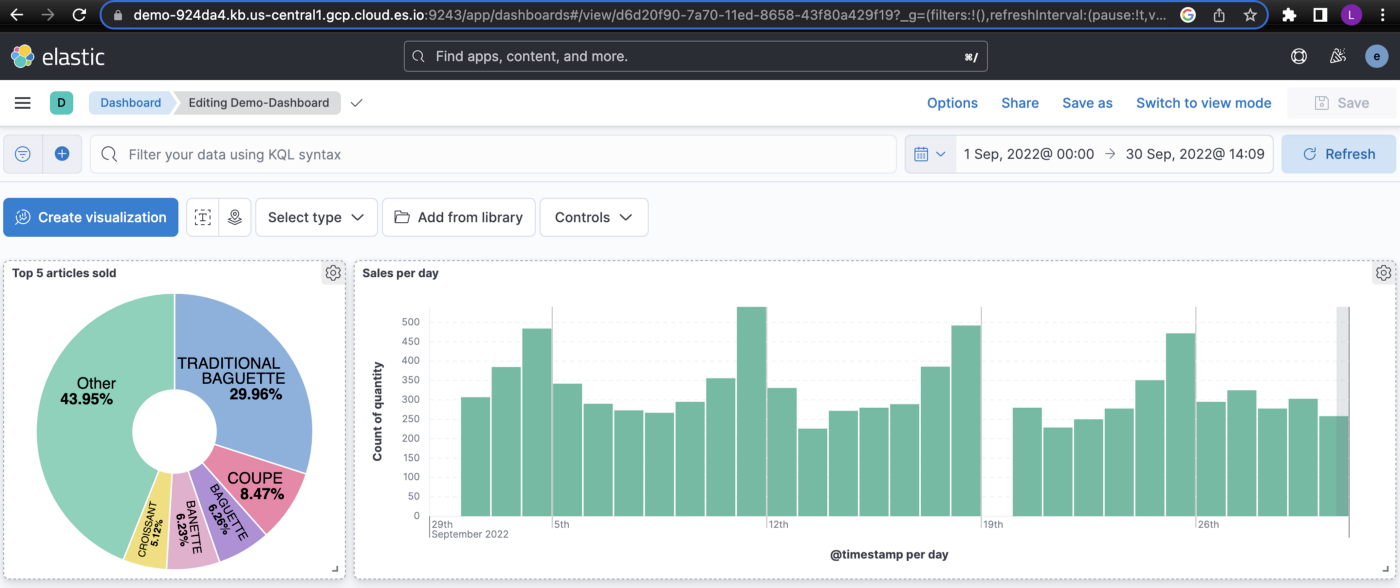
We created two visualizations here, the pie chart shows the top 5 articles that were sold and the bar chart shows the sales per day for the month of September 2022.
Conclustion
In this blog, I gave a brief introduction to components of Elastic Stack, spun up an elastic and kibana instance using elastic cloud, setup logstash on our local machine, built a logstash pipeline to ingest sample data into Elasticsearch and built some visualizations. I hope this gave you an introduction to Elastic stack and some of its features. I will include the link to the conf file below.