Eat, Sleep, Poop: Creating a Baby Dashboard

This year I experienced two major life changes: the birth of my first child and a move to an exciting and parent-friendly startup, Eppo. During Eppo's generous parental leave—in between changing diapers and binge watching Gilmore Girls—I created a baby dashboard to help my wife and me track sleep and I/O (milk & diapers) for our new family member.
The dashboard was built using Metabase backed by Postgres and consists of five charts and a table. The two data sources were the awesome Baby Feed Timer iPhone app and the Snoo Smart Bassinet API.
The charts are outlined below.
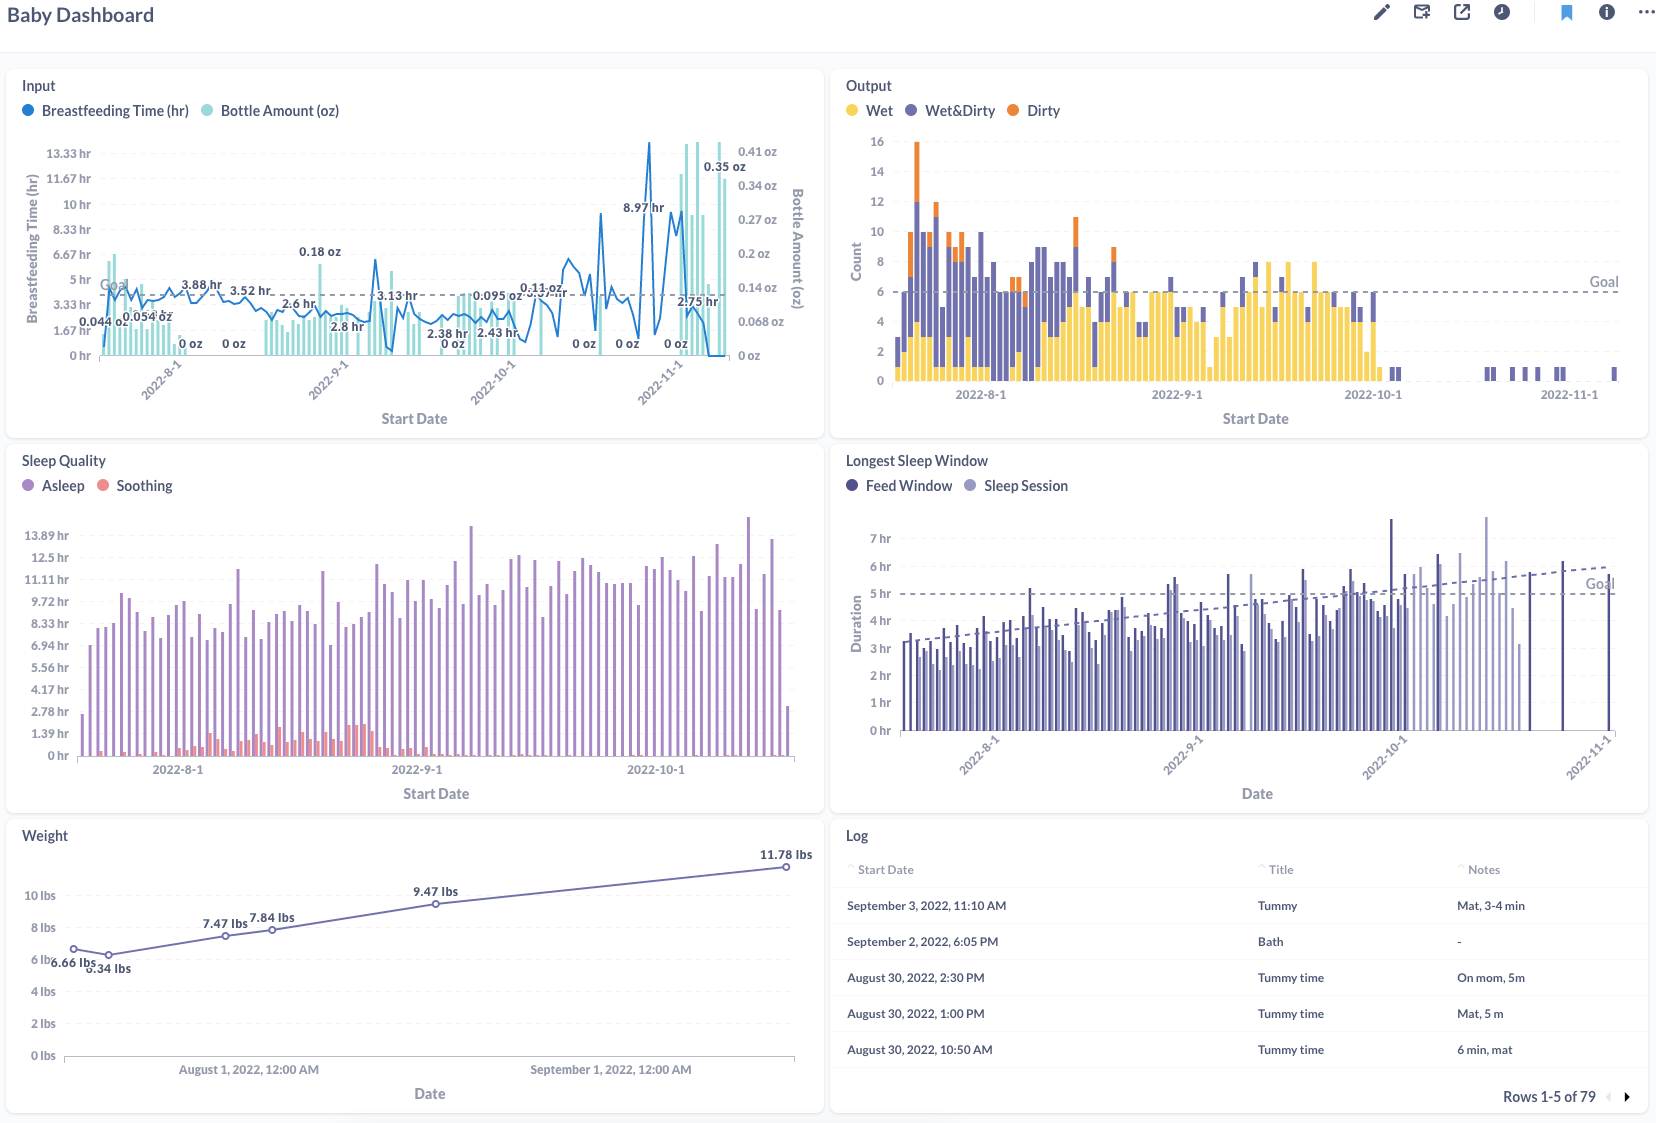
Input
This chart got the prime real estate on the dashboard because it was the most referenced during those early days. One series tracks time spent breastfeeding (hours) while the other tracks volume of bottle feeding (oz).
In the beginning you can see where we had to "triple-feed" (🫠) until the pediatrician allowed us to wind that down. During October, there is a period characterized by missing data and more breastfeeding when I went back to work and my wife was still on leave. The final section of the chart where bottle volume spikes is when my wife went back to work and I took my second half of leave.
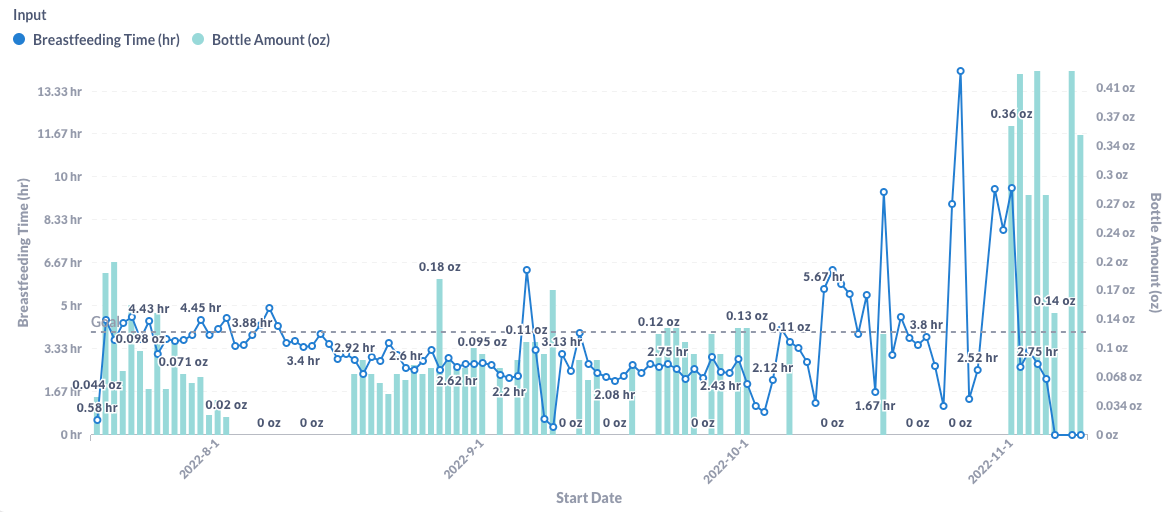
Output
This is a simple count of diapers grouped by type. You can see the early days of rapid-fire pee/poop, the transition to a stable "mostly pee" phase, and then the part where we gave up and only logged poops. It was a useful chart early on.
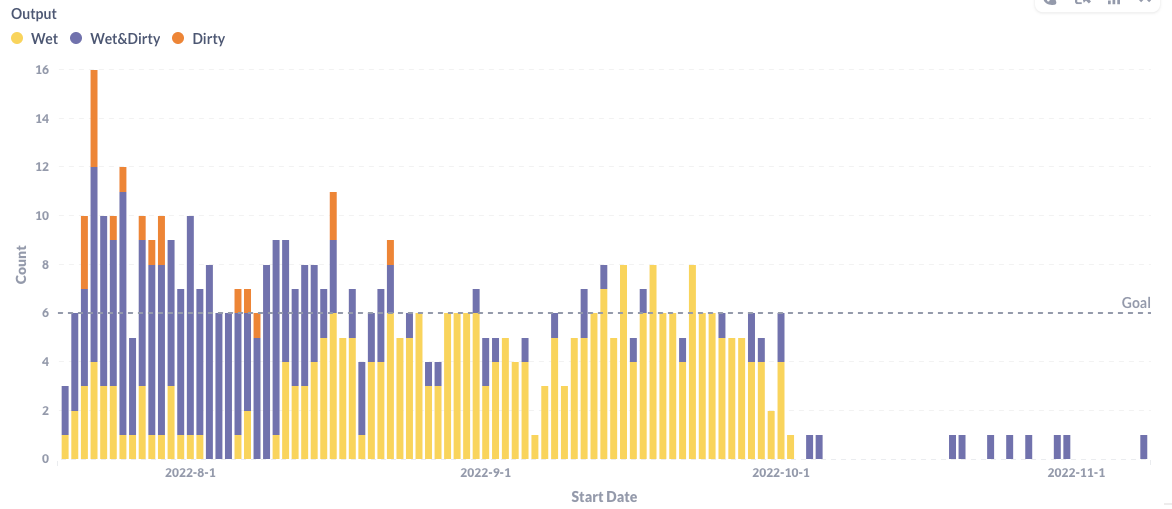
Sleep Quality
This chart is a simple visualization of Snoo sleep logs. The bassinet goes into "soothing" mode if it detects crying, where it attempts to sooth the baby by rocking and increasing the volume of white noise. It worked pretty well for us early on but after a few months we stopped using that feature. For the period where we were using the soothing feature, the data gives a clear picture of how a baby can transition from calm to "seems fussier than normal" to a bleak inescapable hellscape of sleep deprivation.
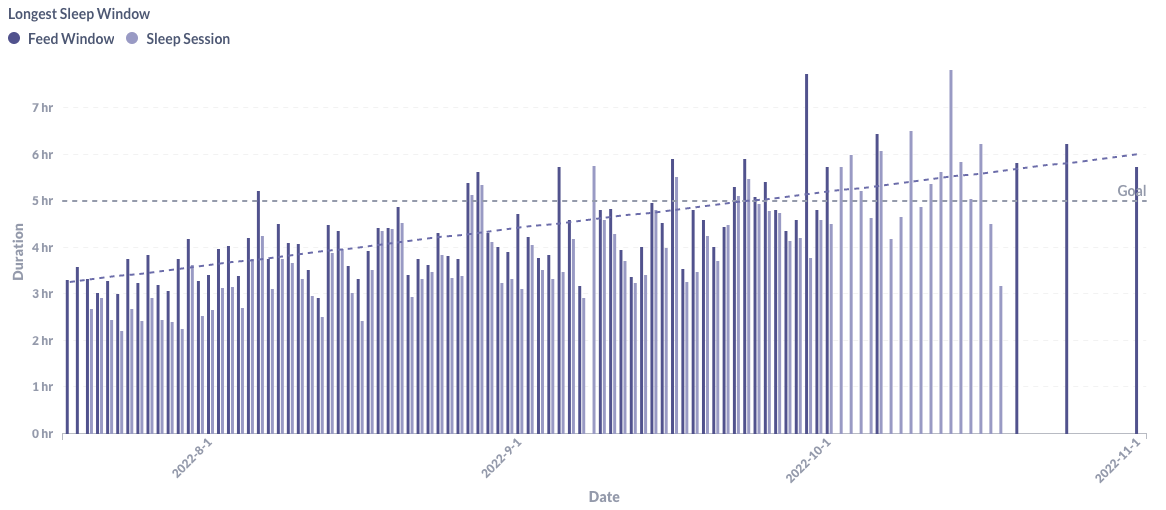
Longest Sleep Window
As new parents, we had a strong interest in one metric: The longest stretch of sleep we got overnight. This chart attempts to capture this "longest nightly sleep window" using both Snoo data and feeding data from Baby Feed Timer. The Snoo logs the length of each sleep session, so that was simple to query and visualize. The feeding data was trickier since it only logged timestamps of feedings, and I ended up with an overly complex four-CTE/two-window-function query to get the longest stretch between feedings during the night.
We wanted this chart to go up and to the right 📈 and you can see it mostly did just that. Metabase also lets you set a "Goal line" to keep you naively hoping for more sleep.
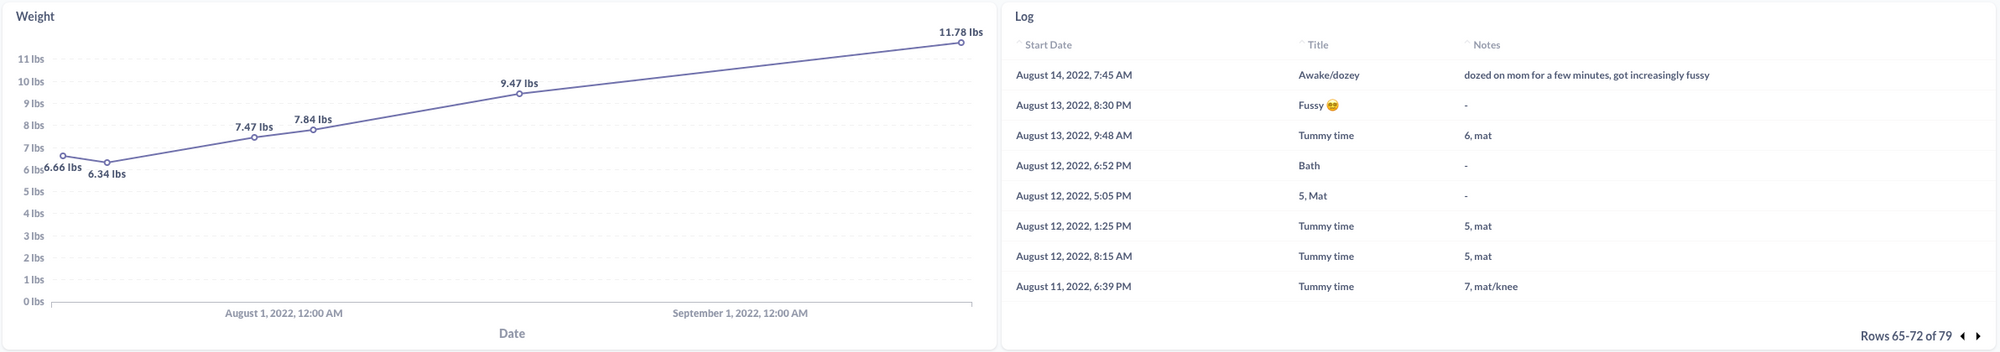
Weight & Log
Self-explanatory. We were only weighing during doctor visits, so there isn't a lot of data. The log is just a table of "notes" entries from Baby Feed Timer.
Architecture
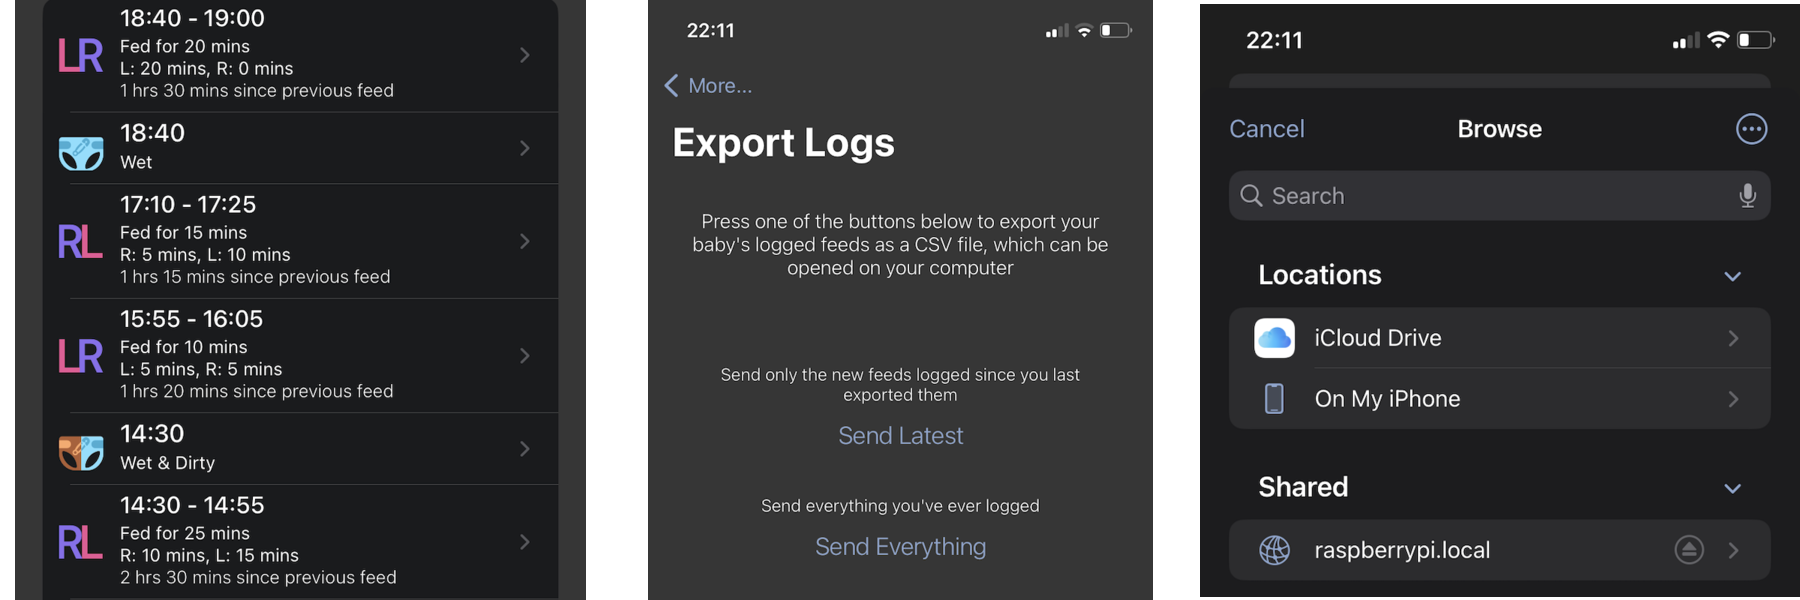
For my at-home dashboard, Metabase and Postgres are running as Docker containers on a Raspberry Pi. To get the data into Postgres, there is a script to import CSV files exported from from Baby Feed Timer, and a script to import Snoo data from the local network via the snoo library. The Baby Feed Timer data could simply be loaded as-is into the database, whereas the Snoo import required plagiarizing a S/O post (which cites this blog).
I also thought it would be cool to have the dashboard automatically update using a combination of Samba and entr. The Samba server runs on the Pi, and any iPhones on the local network can authenticate and mount a shared folder. In a few button-presses you can export a CSV from Baby Feed Timer and save it to the shared folder. A simple watcher script uses entr to monitor the shared folder for file updates and trigger the import scripts. The stdout and stderr from the script is redirected to a log file using nohup.
The result was that both my wife and I could update the dashboard by hitting "export CSV" from Baby Feed Timer on any device with the app.
Conclusion
Was it useful? Barely. Was it fun? Yes. Did I learn anything? Mostly a new fear of hackable devices with write APIs connected to my child.
Now that the baby is getting older, we don't rely on the dashboard as much, but it's fun to show people when they visit and it's a cool journal-like artifact from those crazy early days.
Config code and scripts are here: https://github.com/chasdevs/baby-dashboard